In my previous post, The Forgotten Aspect of Situational Awareness, I mentioned the need for a specialized threat assessment in order to create a realistic plan. This will be at least a two part post explaining what a specialized threat assessment is, how to make one and how to use the information by expanding on some concepts from my last post and the habits post.
A specialized assessment is used when there isn’t a need for a full assessment. For example, while working in anti-piracy, I’d evaluate a daily report from the United Kingdom Marine Trade Operations (UKMTO) based out of Dubai, U.A.E. I used the information provided in the report to brief the Captain of the vessel on high pirating areas, current tactics being used and what was needed to mitigate the threat. I didn’t need to create a full assessment on weather, natural disasters, contagious diseases in the port country, etc. because I was specifically there to prevent piracy. This is the same concept for creating a specialized threat assessment when formulating a plan. Although, the assessment can be done for whatever threat you decide you have. For example, if you live in an area that is prone to flash floods, hurricanes, or has ties to terrorist organizations, an assessment could be created for each to mitigate as much of the threat as possible or, at a minimum, be prepared for it.
For this post we are focusing on criminal violence. Creating this assessment will help you determine the probability of and type of criminal violence you may face in a given location or route and what you can do about it. Primarily, these assessments should be made around the places you spend the majority of your time and the route between those places. That place could be home, work, school or any number of locations. With that being said, doing an assessment of an area for the future is always a good idea. For example, if you are looking for a new apartment or house, sending your kids off to university, or recently been offered a new job in an unfamiliar area, having this information will help you make the best possible decision.
I like to start out by getting an idea of the recent crime in the overall area. Most law enforcement agencies make the quarterly crime statistics easily accessible through their website. I look at the overall crime in a city to get an idea of what I may be dealing with. Here is an example of crime statistics for the first quarter of 2014 in New Orleans, La.
According to this report, every type of crime is up except for burglary and murder. For this example, I’m going to focus on violent crime. I’m using the murder rate due to ease of numbers. In reality, using murders and aggravated assaults gives a more accurate picture. When someone survives an attack, the crime is usually categorized as aggravated assault unless intent to cause death can be proven, then attempted murder will most likely be the charge.
In this example, despite the murder rate declining by 27.91% (down from 43 to 31), it’s still alarmingly high.[1] I took the number of homicides and compared it to the national homicide average, provided by the Center for Disease Control and Prevention (CDC) statistics, which showed 5.2 per every 100,000 people per year.[2] When taking the population of New Orleans (378,715) and comparing it to the numbers provided by the CDC, we can see that New Orleans should be no more that 20.8 for the entire year.[3] Take these numbers with a grain of salt since the statistics that are provided from each agency aren’t all within the same time frame (remember we are trying to get a general idea of the violent crime).
With a little research, I was able to get a general idea of the overall violent crime for the area. Now, I need to compare those numbers to the crime in my specific area. A good resource for this is CrimeMapping.com. This website works with many law enforcement agencies to report the most recent crime data, then takes that information and plots it on an interactive map. Not all agencies use this service, some use others that are similar. Some minor internet research will yield several options.
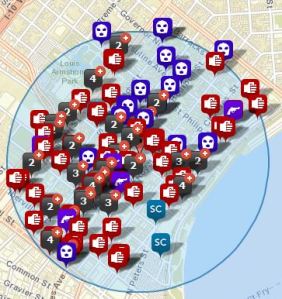
Using CrimeMapping, I can pick which crimes I would like it to plot between the range of dates I choose.
For this example, I’m only choosing assault, homicide, robbery, sexual crimes, and weapon crimes. I have chosen a popular restaurant in the New Orleans area and selected a radius of 0.5 miles. I would recommend going back at least three months and choosing a radius that fits your needs (think about locations nearby that you visit or where you park your car, etc). In this case, there was a total of 163 crimes.
CrimeMapping has a tool for creating a trend report, this is very useful for analyzing larger time frames.
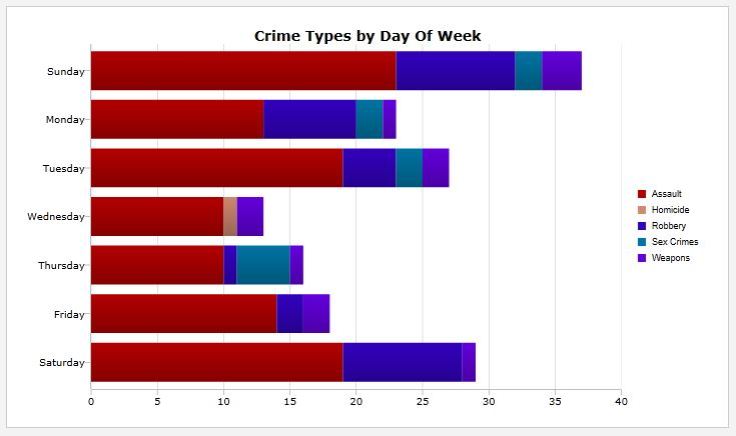
The Crimes are also broken down by the day of the week.
There is also a detailed report which shows each incident and the details. To make the information easier to work with and recognize trends, I organize the list by crime type.
Once I have a breakdown of the crimes, I look at what time the crimes occurred. I focus on the the crime that is happening during the times that I will be in the area. When I complete this analysis, I assign a severity rating and a probability rating to each category. When assigning probability and severity ranking you can create a system yourself or use the one mentioned here. A quick note when assigning a probability rating; if there is a high amount of a specific type of crime, it doesn’t necessarily mean the probability is going to be high. The amount of crime must be compared to the times and days that you will be in the area.
You can make this assessment as general or as detailed as you would like. For example, if there are several cases of simple robbery in an area with several cases of illegal carrying of a weapon, I may want to increase the probability of armed robbery or discharging of a firearm. This can only be done manually and can be quite time consuming. This process should be done for each location you spend the majority of your time.
At this point, we have established how to gather the information you need. In the next post, I’m going to explain how we use this information to create a realistic plan and bring in concepts from others posts.
1 New Orleans Police Department, Uniformed Crime Reporting (UCR) First Qtr 2014. n.d. Retrieved from http://www.nola.gov/getattachment/f900c181-13df-4e8c-9629-b79719673111/1st_Qtr_2014_Citywide-UCR/
2 Center Center for Disease Control and Prevention, Fast Stat, July, 14 2014. Retrieved from http://www.cdc.gov/nchs/fastats/homicide.htm
3 United States Census Bureau, State and Country Quick Facts, July 8. 2014. Retrieved from http://quickfacts.census.gov/qfd/states/22/22071.html


Great Post. This describes a very effective way of creating a realistic assessment of the type of threats you may encounter, your risk level based on context and developing appropriate mitigation strategies.
LikeLike
Thank you for the positive feedback! Is there anything that you would add that would make the assessment better?
LikeLike
The only thing I would add is that in some locations oversees it can be difficult to get that kind of crime data or the data may be less reliable for a variety of reasons — particularly in developing countries. The methodology is the same just it can be harder to get good reliable resources and more will be based on anecdotal information.
LikeLike
Agreed, thank you!
LikeLike